Comprehensive Analysis of NEPSE Today -Indicators Review of Kartik 12

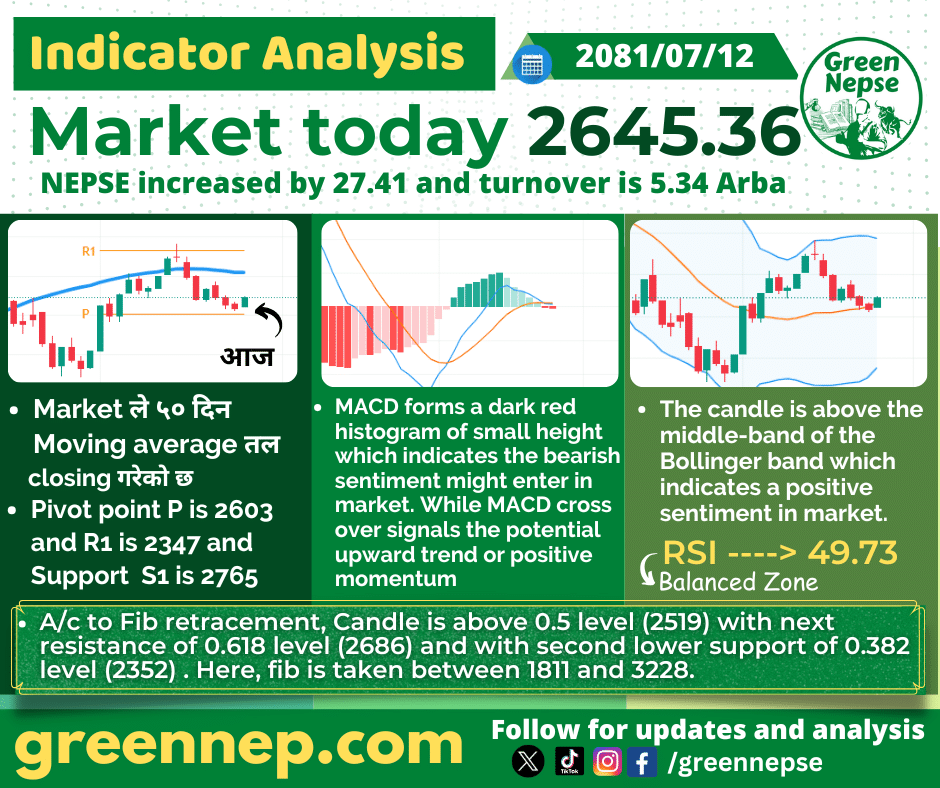
Today, NEPSE closed at 2,645.36, marking a green day after three consecutive days in the red. The market increased by 27.41 points compared to the previous day’s close of 2,617.95. Today’s turnover was recorded at 5.34 Arba, reflecting a moderate activity level as traders showed renewed optimism in the market.
Prior to this, the NEPSE index had been experiencing a bearish phase, with three days of consecutive declines. However, today’s uptick offers a glimmer of hope that market sentiment may be shifting towards recovery.

Next Upcoming Possibilities
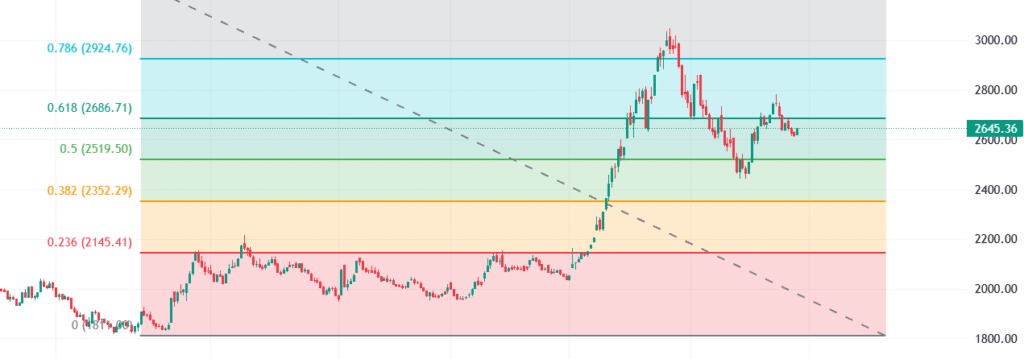
The market’s closing above the 50-day moving average and bullish indicators suggest the possibility of continued upward movement. Investors should closely monitor the behavior of key resistance levels. If the market can break past the 0.618 Fibonacci resistance level at 2686, we could see more bullish momentum unfold.
However, if the market dips below the 0.382 Fibonacci support at 2352, it could reignite bearish sentiment and lead to further declines.
NEPSE Today’s Indicator Analysis
1. Moving Averages and Pivot Points
The market closed below the 50-day moving average, indicating that we are still in a cautious zone, but the reversal in today’s green candle provides a positive sign. The pivot point for today is set at 2603, with resistance R1 at 2347 and support S1 at 2765.
2. MACD
The MACD histogram is forming a small dark red bar, signaling that bearish momentum might still persist. However, a MACD crossover could bring a positive upward trend if it occurs, indicating momentum might shift towards a more bullish market in the coming days.
3. Bollinger Bands
The candle is positioned above the middle band of the Bollinger Bands, suggesting that the market is in a more positive sentiment territory. This could indicate a short-term rally, but the market needs to sustain this movement for further confirmation.
4. RSI (Relative Strength Index)
The RSI is currently at 49.73, which lies in the balanced zone. This indicates that the market is neither overbought nor oversold. Traders should watch for any RSI movements beyond 70 (overbought) or below 30 (oversold) for potential trend shifts.
5. Fibonacci Retracement
According to Fibonacci levels, the market is currently trading above the 0.5 retracement level at 2519, which acts as a critical support level. The next key resistance level is at 2686 (0.618 retracement), and the second lower support sits at 2352 (0.382 retracement). This range should be watched closely as a break above resistance could push the market higher, while a dip below support could trigger further declines.

Conclusion
Today’s positive performance provides some hope for investors after three days of decline. While the market sentiment is tilting towards the bullish side, traders should remain cautious, keeping a close eye on MACD crossover signals, Bollinger Band movements, and Fibonacci levels. If the market can breach the key resistance points, we could be in for a rally; however, failure to do so might trigger another downturn.
Stay tuned to GreenNepse for fast and reliable updates on NEPSE trends. Follow us on Facebook and Instagram for the latest stock market news and analysis.


