Comprehensive Analysis of NEPSE Indicators of Shrawan 01

Market Overview
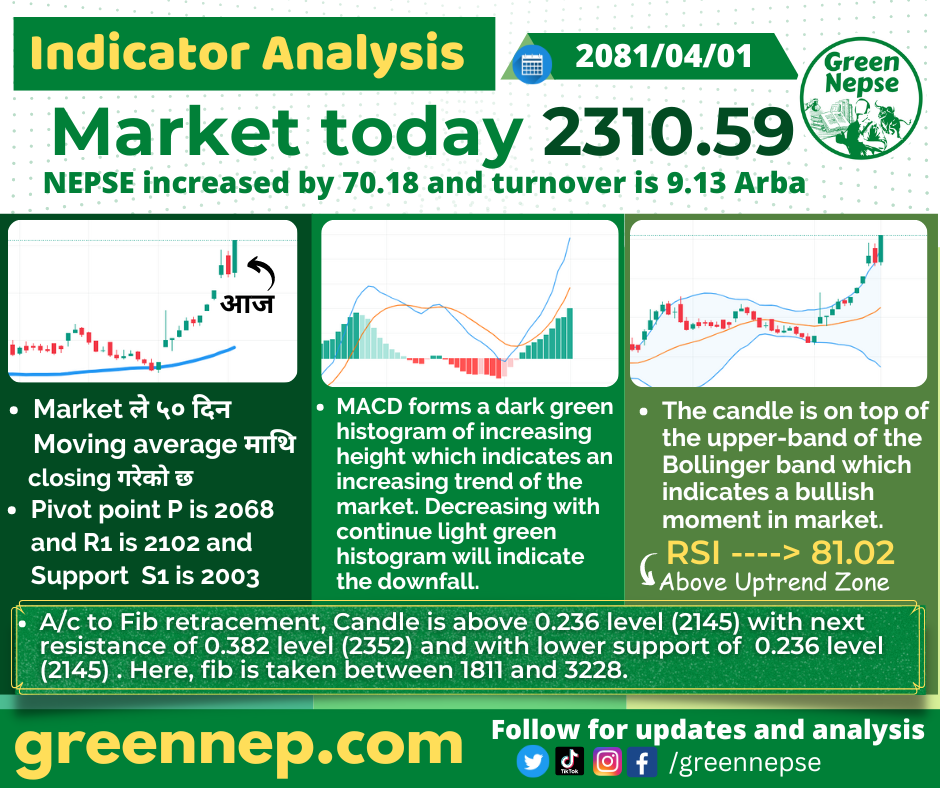
The NEPSE index has shown a significant increase today, closing at 2310.59, which is up by 70.18 points. The market turnover for the day stands at 9.13 Arba. This positive movement is reflected in several key technical indicators, suggesting a bullish trend.

Moving Averages
- 50-Day Moving Average: The market has closed above the 50-day moving average, indicating a positive momentum. This is a strong bullish signal as it shows that recent prices are higher than the average price over the past 50 days.
Pivot Points
- Pivot Point (P): 2068
- Resistance (R1): 2102
- Support (S1): 2003
The pivot point for today is at 2068, with the first level of resistance at 2102 and the first level of support at 2003. The market is currently well above the pivot point, indicating a strong upward trend.
MACD (Moving Average Convergence Divergence)
The MACD indicator shows a dark green histogram with increasing height. This suggests a strong upward trend in the market. However, if the histogram starts to decrease and turns light green, it may indicate a potential downturn.
Bollinger Bands
The candlestick is positioned on top of the upper band of the Bollinger Bands. This is typically a bullish signal, indicating that the market is experiencing higher volatility and is likely to continue in an upward direction.
Relative Strength Index (RSI)
The RSI value is at 81.02, which places it in the above uptrend zone. An RSI above 70 generally indicates that the market is overbought, but it also confirms the current bullish momentum.
Fibonacci Retracement
According to Fibonacci retracement levels:
- The current candle is above the 0.236 level (2145).
- The next resistance level is at the 0.382 level (2352).
- The lower support is also at the 0.236 level (2145).
These levels are calculated based on the Fibonacci sequence, taken between the points 1811 and 3228. The fact that the market is above the 0.236 level suggests continued bullish behavior with the next target being the 0.382 level.
Conclusion
Today’s NEPSE indicator analysis by Green NEPSE highlights a strong bullish trend supported by various technical indicators such as moving averages, MACD, Bollinger Bands, RSI, and Fibonacci retracement levels. Investors can leverage this analysis to make informed decisions and capitalize on the upward momentum in the market.
For more detailed analysis and updates, visit Green NEPSE and stay ahead in your investment journey. Follow us on social media for real-time updates and insights.


