Comprehensive Analysis of NEPSE Today -Indicators Review of Shrawan 31

Market Overview
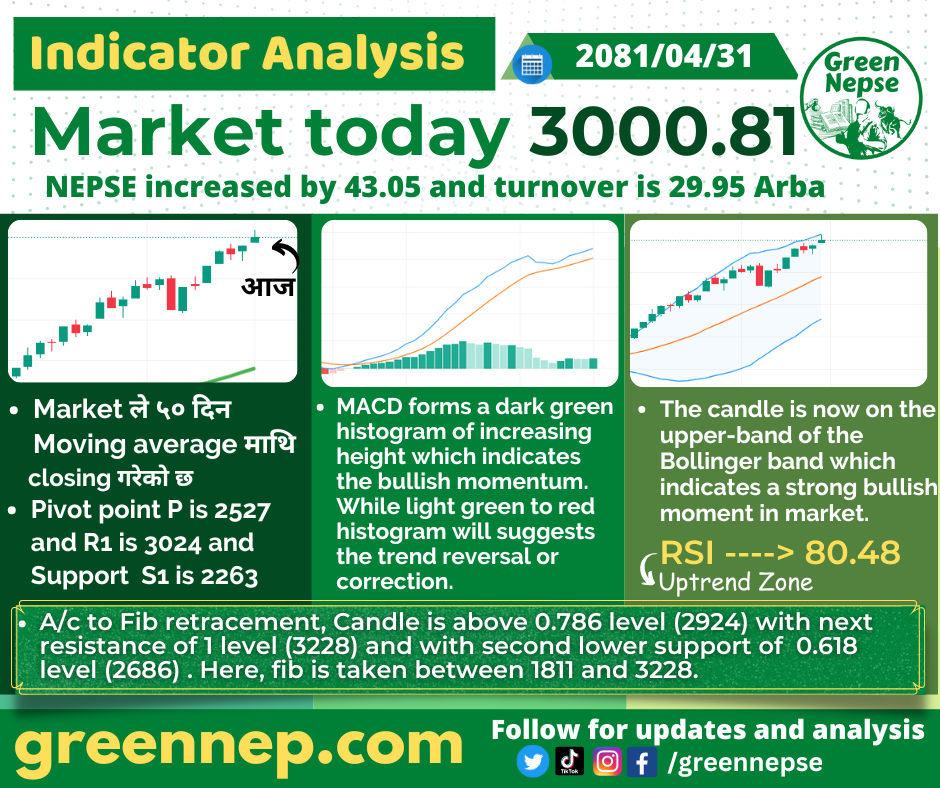
The NEPSE index has made a significant leap today, closing at 3000.81, marking an increase of 43.05 points. The market turnover reached a historic high of 29.95 Arba, indicating a robust trading day and strong investor participation.

Moving Averages
- 50-Day Moving Average: The market continues to close above the 50-day moving average, reinforcing the ongoing bullish momentum. This consistent performance suggests that the current market prices are well above the average prices over the last 50 days, which is a positive indicator for investors.
Pivot Points
- Pivot Point (P): 2527
- Resistance (R1): 3024
- Support (S1): 2263
Today’s pivot point is at 2527, with the first level of resistance at 3024 and the first level of support at 2263. The market’s upward trajectory beyond these pivot points indicates continued strength and potential for further gains.
MACD (Moving Average Convergence Divergence)
The MACD indicator forms a dark green histogram of increasing height, signaling strong bullish momentum. This is a positive sign, suggesting that the market trend is upward. However, investors should watch for any transition from light green to red histograms, which may indicate a potential trend reversal or correction.
Bollinger Bands
The candlestick is now positioned on the upper band of the Bollinger Bands, signifying a strong bullish trend. This placement indicates that the market is experiencing high volatility with a positive outlook, as the prices are reaching higher levels within the bands.
Relative Strength Index (RSI)
The RSI value stands at 80.48, which places it in the uptrend zone. An RSI above 70 typically signals that the market is overbought, but it also confirms the bullish momentum. This high RSI suggests strong buying pressure and investor confidence.
Fibonacci Retracement
According to Fibonacci retracement levels:
- The current candle is above the 0.786 level (2924).
- The next resistance level is at the 1 level (3228).
- The lower support is at the 0.618 level (2686).
These levels, derived from the Fibonacci sequence between the points 1811 and 3228, indicate that the market has strong upward potential, with resistance at 3228 being the next critical level to monitor.
Conclusion
Today’s NEPSE indicator analysis by Green NEPSE showcases a market characterized by significant growth and historic turnover. The strong technical indicators, such as moving averages, MACD, Bollinger Bands, RSI, and Fibonacci retracement levels, all support a continued bullish outlook. Investors should remain vigilant for any signs of trend reversal but can take confidence in the current positive market conditions.
For more detailed analysis and updates, visit Green NEPSE and stay ahead in your investment journey. Follow us on social media for real-time updates and insights.


