Nepal Stock Market NEPSE Indicators analysis of Kartik 06

Market Overview – 2081/07/06
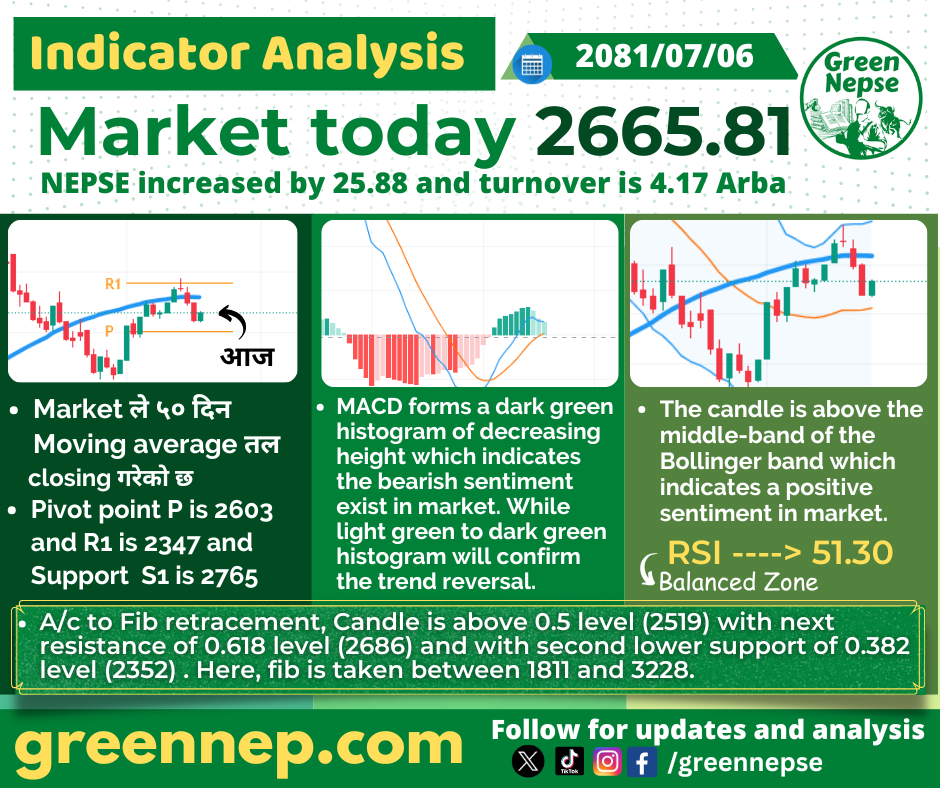
NEPSE Index: 2665.81
Change: +25.88 points
Turnover: 4.17 Arba
Today (Kartik 06, 2081), the NEPSE index increased by 25.88 points, closing at 2665.81. This minor gain reflects a positive sentiment despite the bearish indicators observed earlier in the market. The total turnover for the day was 4.17 Arba, indicating a lower participation compared to the previous sessions but still showing strength at current levels.

Technical Analysis:
Moving Average:
- Market 50-Day Moving Average: The market is closing below the 50-day moving average, signaling a potential weakness in the trend. A close below this average often hints at bearish market behavior, but it also provides an opportunity for the bulls to regain momentum if they can reclaim this level in the coming sessions.
Pivot Points:
- Pivot Point (P): 2603
- Resistance (R1): 2347
- Support (S1): 2765
The pivot point and resistance levels show that the market is attempting to recover from earlier losses. The support at 2765 is critical for the continuation of the uptrend, while resistance at 2347 will be a key hurdle for further upward movement.
MACD (Moving Average Convergence Divergence):
- MACD Histogram:
The MACD forms a dark green histogram of decreasing height, signaling that the bearish sentiment has strengthened. However, this downward momentum is slowing, which could indicate a potential trend reversal in the near future. Traders should be cautious, as the light green histogram may confirm a reversal if it appears, indicating bullish momentum.
Bollinger Bands:
- The candle is above the middle band of the Bollinger bands, which generally indicates a positive sentiment in the market. The position of the candle relative to the band shows that the market may continue to consolidate around current levels before breaking out in either direction.
RSI (Relative Strength Index):
- RSI Level: 51.30
The RSI level is in the balanced zone, meaning the market is neither overbought nor oversold. This suggests that the market is in a consolidation phase, with no strong momentum favoring either bulls or bears at this stage.
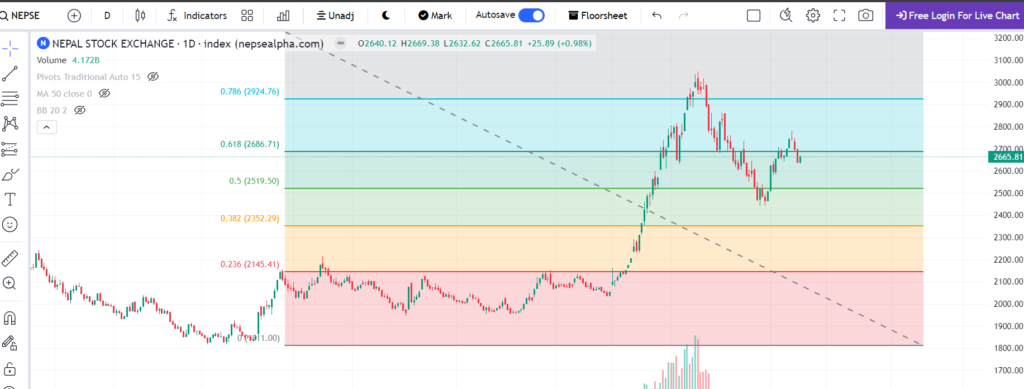
Fibonacci Retracement:
- The current candle is positioned above the 0.5 Fibonacci retracement level (2519), signaling that the market has recovered significantly from recent losses. The next key resistance level lies at the 0.618 Fibonacci level (2686), while support is seen at the 0.382 level (2352). These Fibonacci levels are drawn between the range of 1811 and 3228, providing important guidance for traders watching for market reversals or continuations.

Market Sentiment:
Today’s market close suggests that the bulls are still attempting to regain control despite bearish signals from the MACD. However, with the candle above the middle Bollinger band and the RSI in the balanced zone, the market could consolidate in the short term. The next few sessions will be crucial, as the market tests resistance and traders monitor for potential reversals.
For more detailed analysis and updates, visit Green NEPSE and stay ahead in your investment journey. Follow us on social media for real-time updates and insights.


